03 · SaaS · Dashboard
Analytics Dashboard
Dense product data organised into a calm, scannable interface.
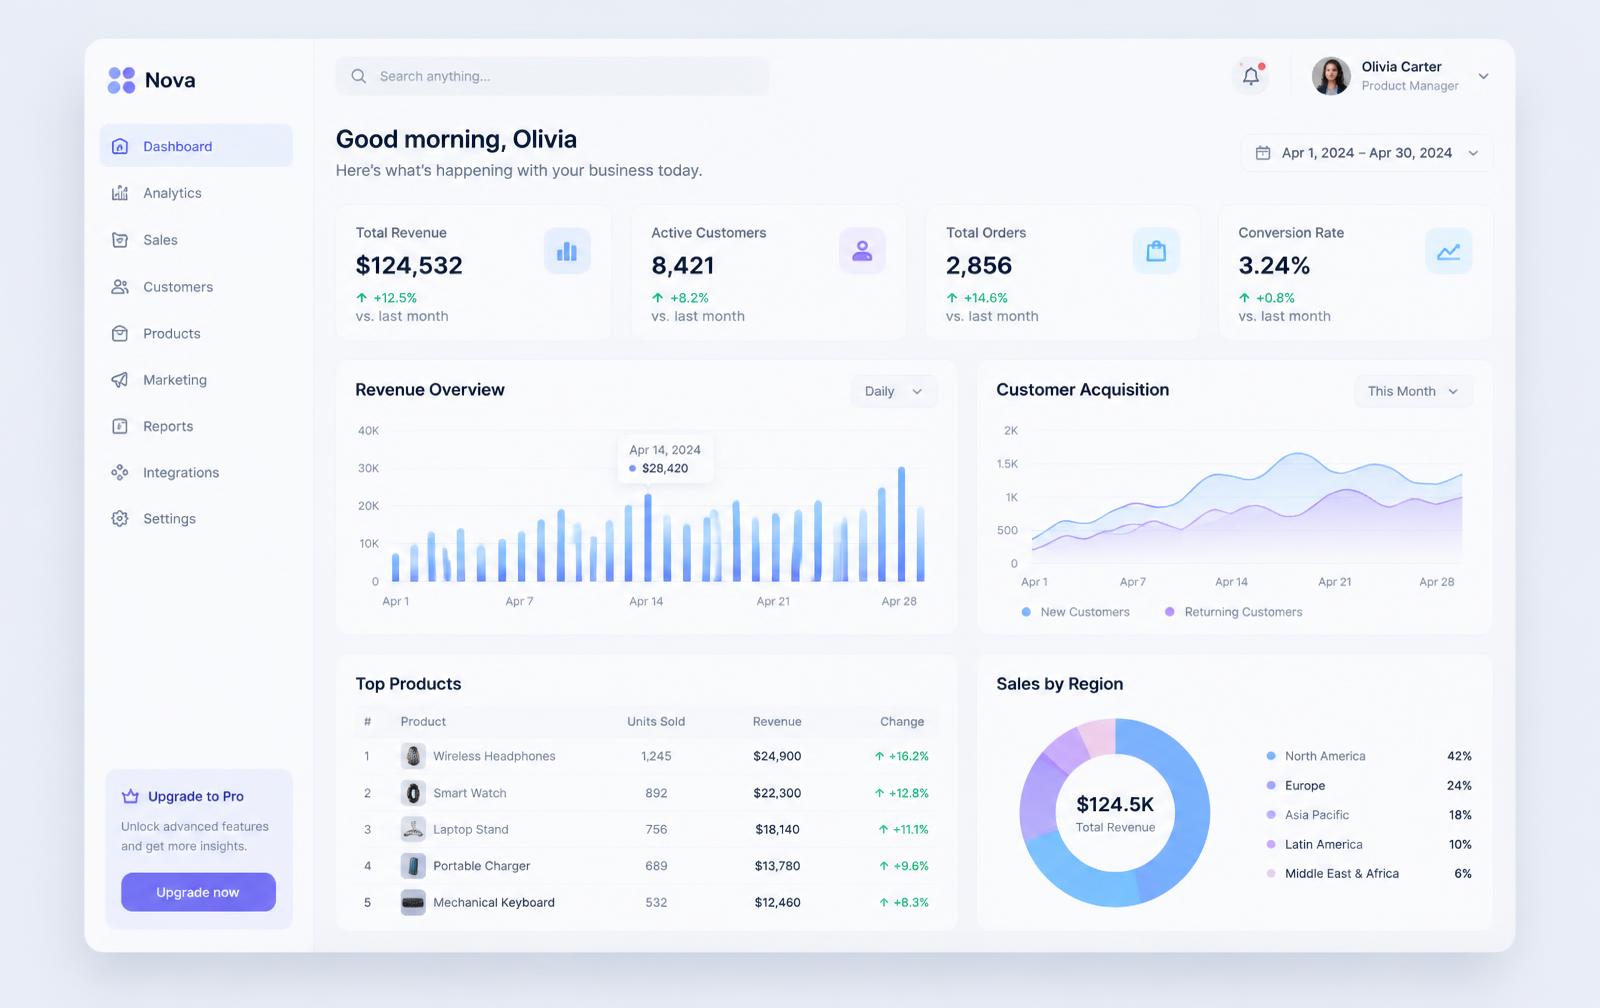
Placeholder visual and copy — replace with the real Figma screens and project story.
The challenge
Placeholder — the data complexity and the user's real job to be done.
The approach
Placeholder — information hierarchy, chart choices and density decisions.
Key screens
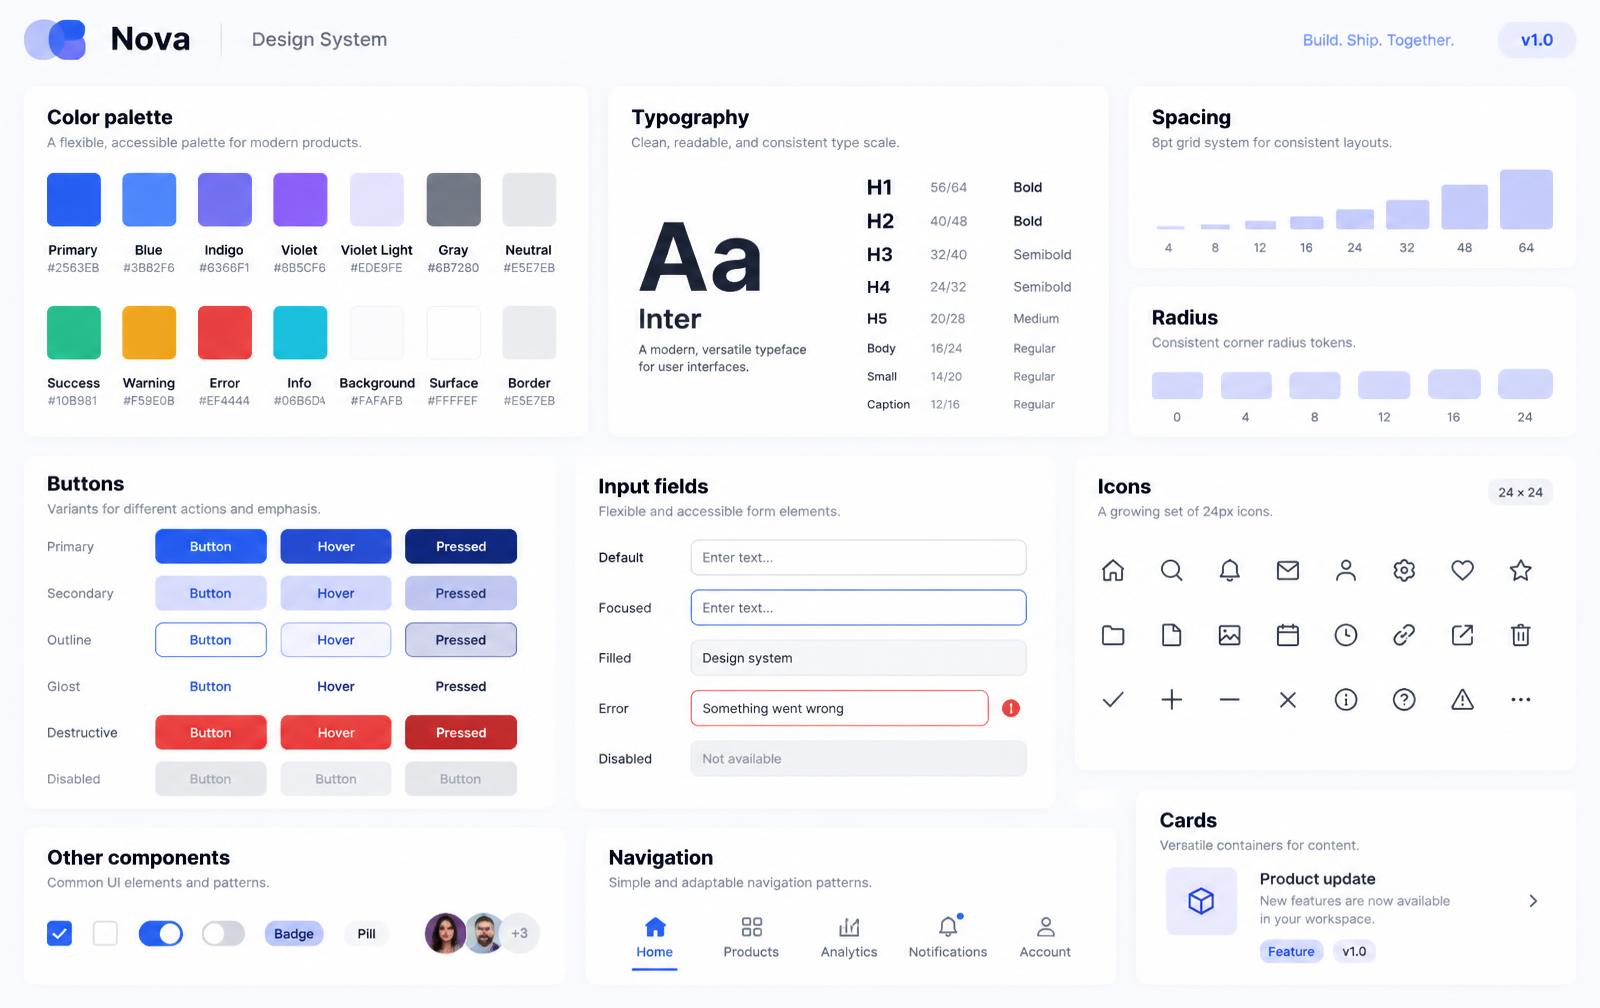
UI system
Data viz paletteTable patternsEmpty states
Want something like this designed for your product?
Next projects